The NatureCounts website features a set of data exploration tools that can help you locate the exact data you need for your work. You can access these tools by navigating to the NatureCounts website and clicking Explore > Species Maps, or Explore > Download Data.
In the explorer, on the Map tab, you can generate maps by entering your species of interest in the Species box. You can display maps by species distribution and breeding evidence, the number of records of a species, or regional population trends by clicking the different options in the upper left.
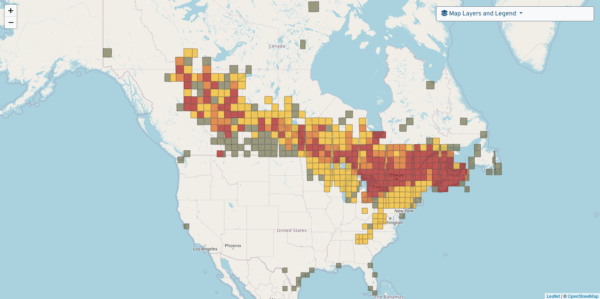
A map of occurrence and breeding evidence.
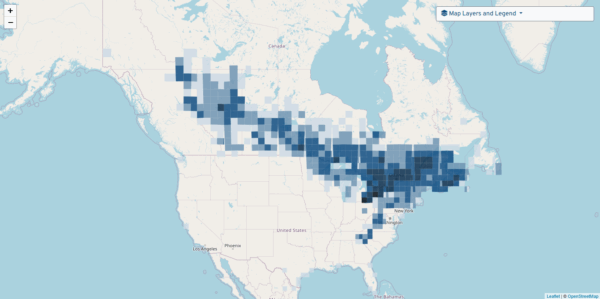
A map of the number of records of a species.
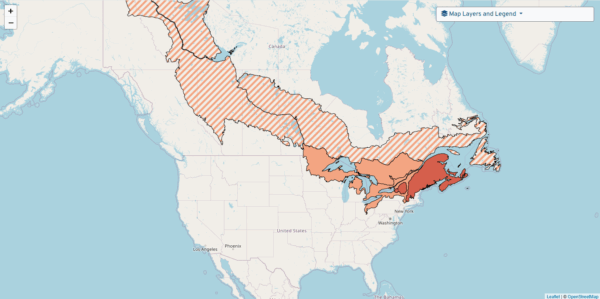
A map of regional population trends.
You can refine your maps by selecting specific projects (for maps by population trends, the Breeding Bird Survey is automatically selected), narrowing the date range, or displaying records with specific levels of breeding evidence.
As you zoom in on a map, the level of resolution increases. At its broadest scale it displays 100x100km squares, then 10x10km squares, and finally specific locations as points on the map. Clicking on a 10x10km square or specific location will display the datasets that contain records of the species for that location. Note that for sensitive species or locations, specific locations are obscured and the maximum resolution is the 10x10km square.
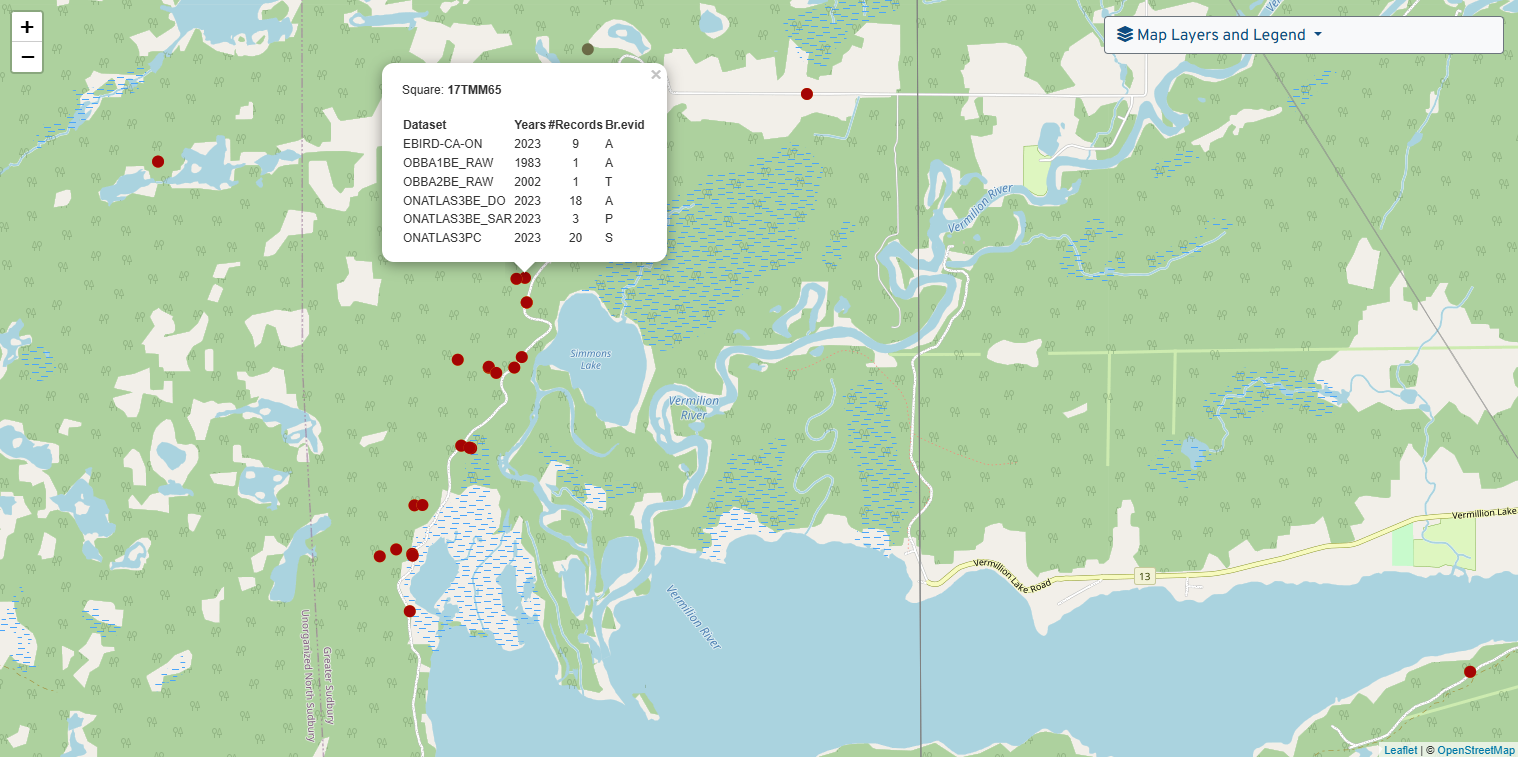
The Map Layers and Legend dropdown in the upper right corner helps you interpret the map, and allows you to add spatial layers like Bird Conservation Regions, Important Bird Areas, and eBird abundance.
When you are ready to download data, select the Download Data tab. If you have entered any filters while on the Map tab, they will be preserved on the Download Data tab. You can clear the filters at any time by clicking Reset.
The Download Data tab displays all available datasets — and the number of records in each — in NatureCounts matching your filters. If you haven’t entered any filters, it will display all available datasets and records.
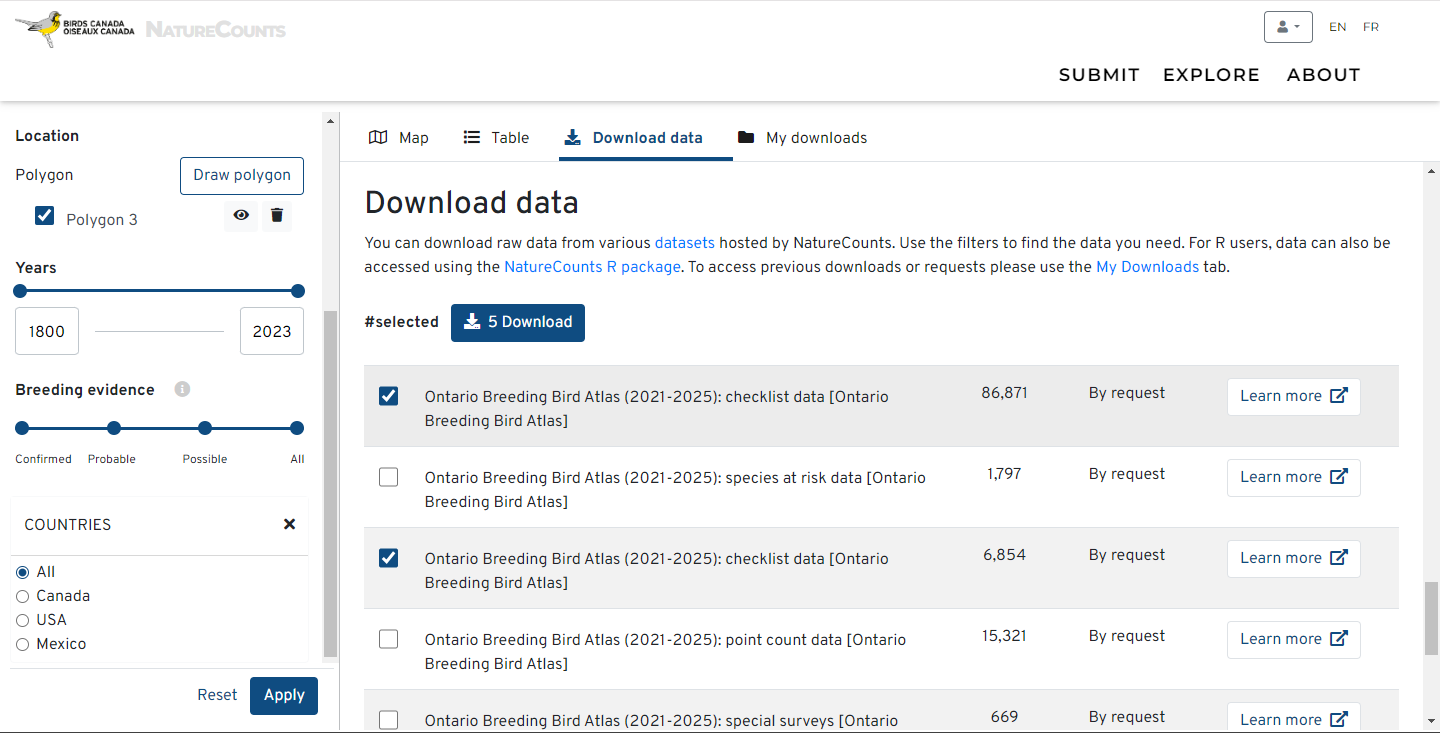
You can narrow your search to a specific location by using the Draw Polygon tool. Clicking Draw Polygon will return you to the map, where you can click to create a custom shape around your area of interest. When you are done, clicking Apply will return you to the Download Data tab and display all relevant data for your polygon.

Next section: Data Request and Review