The Species Maps, along with other data exploration tools, can be accessed under the Explore menu of the NatureCounts website.
The species maps are the ideal place to begin visualizing the data, and allow you to generate maps of breeding evidence, number of records, or population trends for any species. To do this, select the type of data you want to display under “View data type by” and begin typing a species name into the “Species” box. Select your desired species from the dropdown.
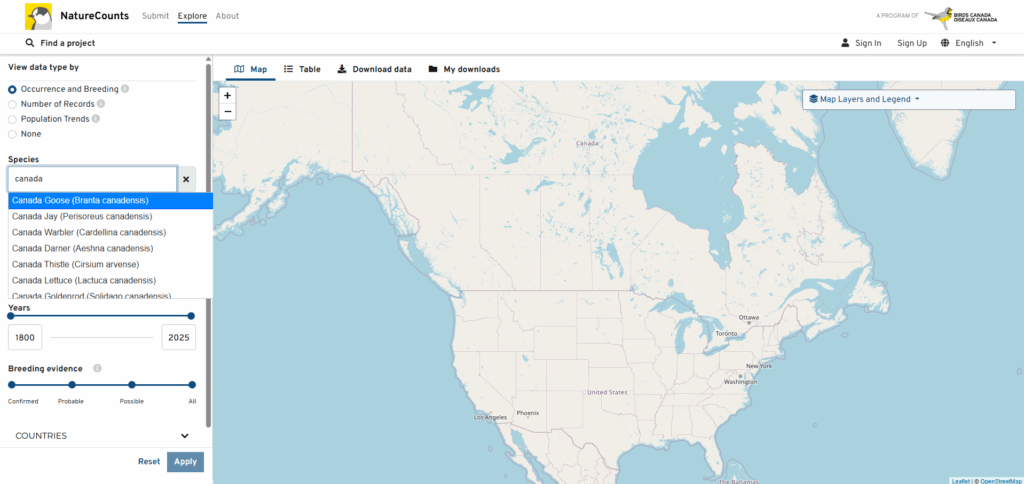
You can further narrow the data by selecting a specific project(s), location, year range, or level of breeding evidence. Note that for population trend maps, the project is automatically set to the North American Breeding Bird Survey. Click “Apply” to generate your map.
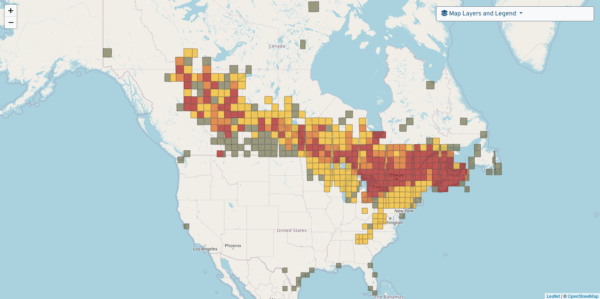
Occurrence and Breeding
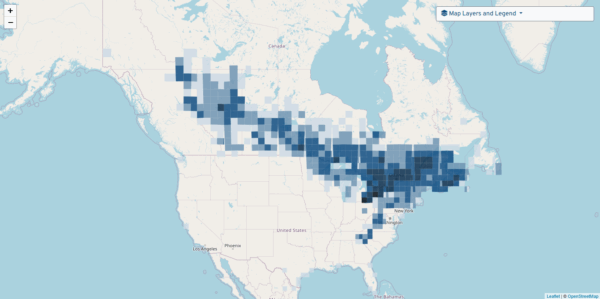
Number of Records
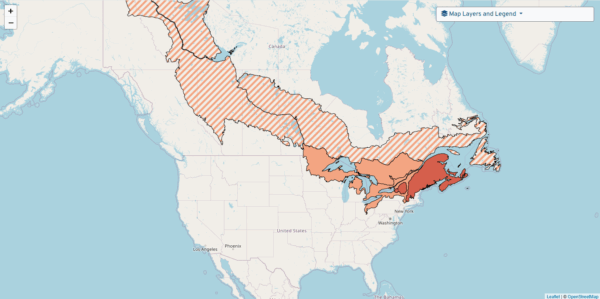
Population Trends
For each map, the resolution increases as you zoom in, and you may click on individual squares or trend points for detailed information. Note that information about sensitive species may only be visible at a lower resolution. In the upper right corner there is a “Map Layers and Legend” panel that will help you interpret the maps, and allow you to add layers such as Important Bird Areas and Conservation Regions.
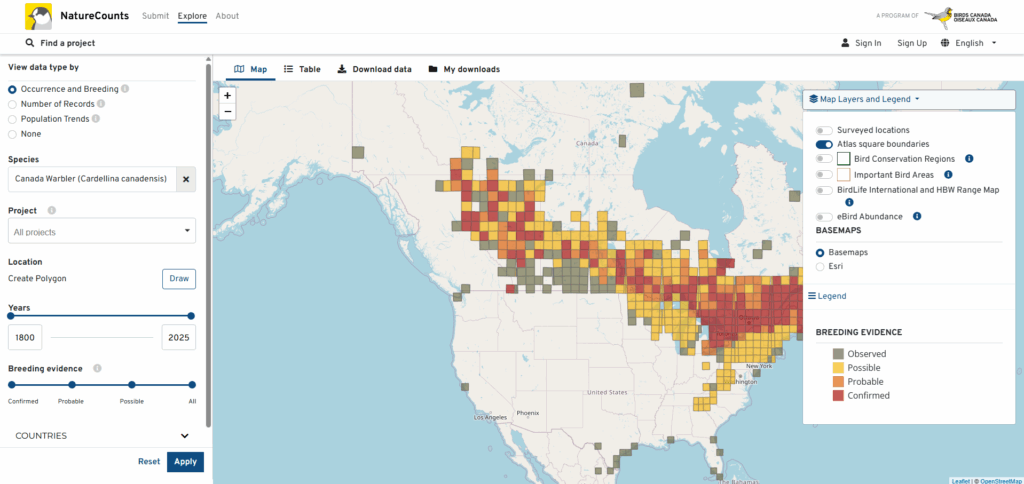
Click “Reset” at any time to clear all your selections and start again.
If you are ready to download data, click on the “Download Data” tab above the map. Your search parameters will be carried over to the Download Data tool.
Next section: Using the Download Data Tool